Senior Research Assistant
Meunier lab
Queensland Brain Institute
"Working in data analysis and visualisation, I come across some pretty cool discoveries. One day I was looking at a cluster that moved over time and knew that I had seen it before in a book when I was a kid. It was a lot of fun drawing the eyes, legs and antennae by hardcoding the coordinates in the software to produce the final result."

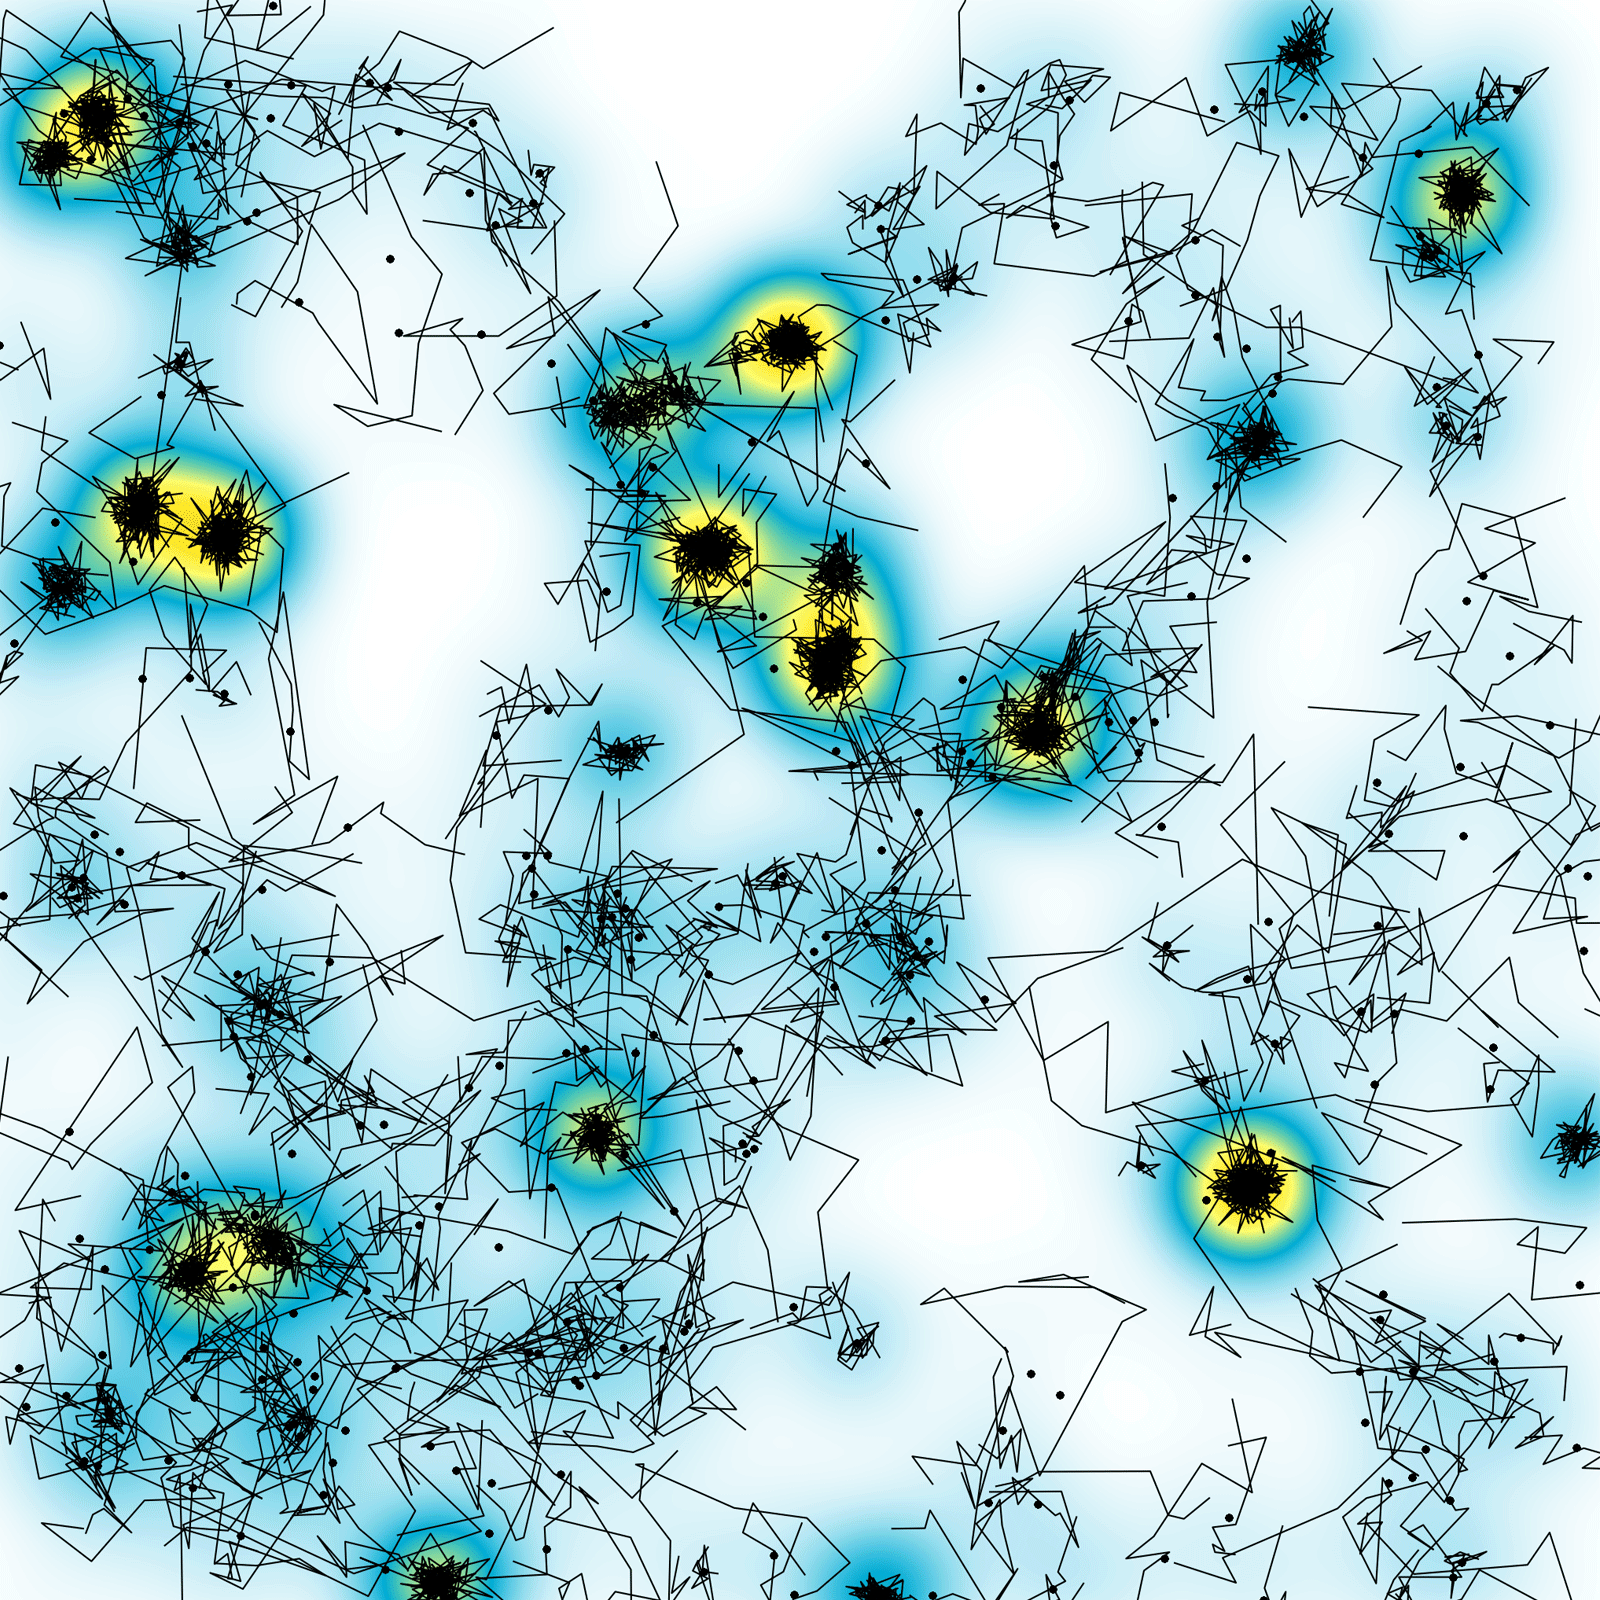
"Both of these artworks were created by performing clustering analysis on single-molecule tracking data. We tag a protein of interest with a fluorescent label so that we can see individual proteins as they move in real time in live cells. We then analyse that movement to see if the proteins cluster together on the surface of the cell. These clusters are important as it helps us understand more about how the proteins behave when they are performing their functions."
This spider web was formed by tracking the movement of a protein called Munc18, which is critically important for communication between our brain cells. From these tracks, we built a network of trajectories (black), which reveals beautiful small clusters (yellow). We discovered that without these small clusters, neurons cannot communicate with each other.
Munc18 trajectories and trajectory centroids (center points) are coloured in black. The density of Munc18 detections is shown from white (no/low detections) to blue (moderate detections) to yellow (high detections indicating clusters).
Caveolin trajectories are coloured by time of appearance (from red to green), and trajectory centroids (center points) are coloured in white.
This very hungry caterpillar is made from a stream of trajectories detected one after the other using single-molecule tracking. These trajectories belong to a particular protein called caveolin, which are responsible for forming tiny little caves on the surface of some of our cells. These caves or caveolae are present in our muscles, allowing them to sustain muscle contraction without shearing. While watching this movie we realised it was very reminiscent of a particular childhood favourite caterpillar.
Trajectories and trajectory centroids (black) super imposed on a kernel density estimation map (yellow: high density), showing how synaptic protein Munc18 clusters on the plasma membrane.
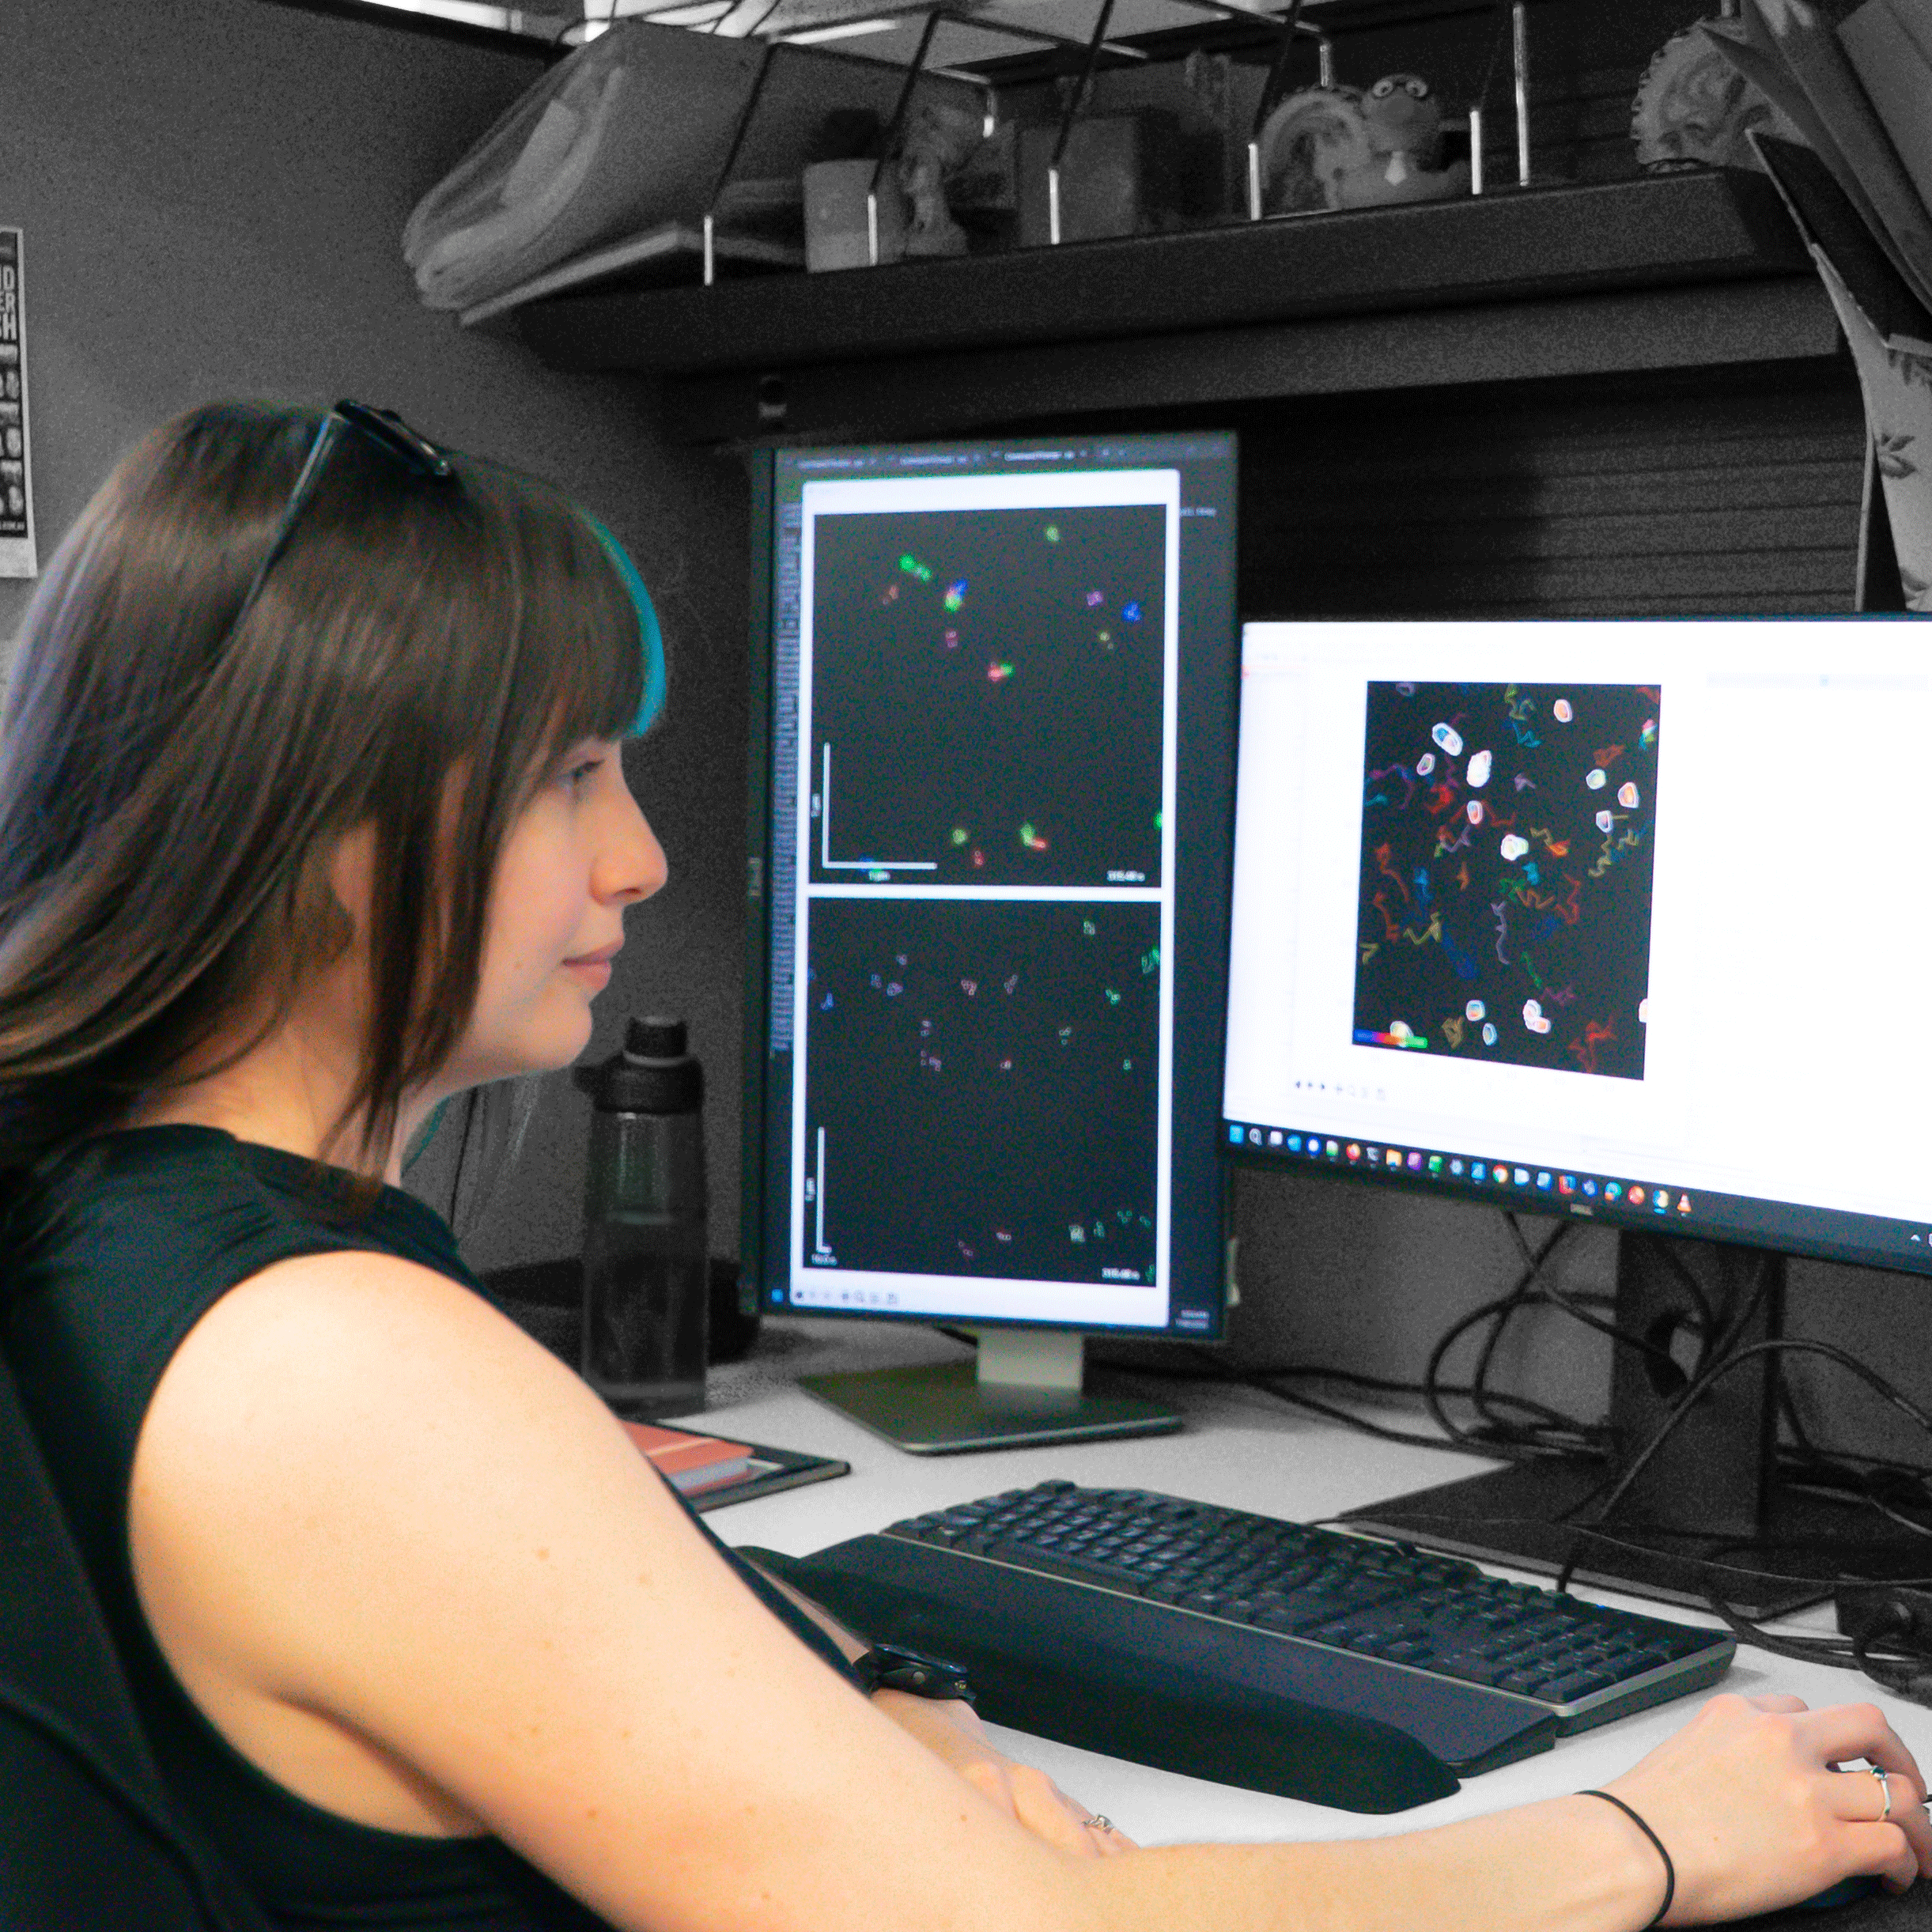
"I am a senior research assistant in the Meunier lab (single molecule neuroscience lab). I perform data analysis for various projects and write GUI-based software for analysing and visualising single-molecule and proteomics/lipidomics data. I also proofread and edit manuscripts and book chapters, and generate illustrations for use in these works."
Alex writes software with graphical user interfaces (GUIs) for analysing and displaying data in ways that enable useful insights into the structure and relationships of the data. I really like making the software and visual outputs as versatile, aesthetically pleasing and user-friendly as possible. Alex generated the images shown here using visualisation tools that she implemented in software that shehelped create.